


The Endurance Economy (Part 1)
An exploration of the emerging trends, growth potential, and challenges in the Endurance Race industry


Introduction
Few industries were as negatively impacted by the COVID-19 pandemic as the Endurance Race industry. Through 2020 and into early 2021, the Endurance Sports Coalition reported over 50,000 events canceled, which left race operators with bills to pay and no revenue.
With in-person experiences no longer an option, many race organizers pivoted to virtual formats to salvage the 2020-21 season. The NYC Marathon had 25,000 people complete the race virtually, 160,000 competed in virtual Rock’n Roll Marathons around the country, and 117,000 people rode the virtual Tour de France on Zwift. On a personal note, my mother and I spent a good chunk of our COVID-19 summer finding hills to climb as part of the Leadville 100,000 vertical feet challenge.
Weathering this worst-case scenario has proved the resilience of the endurance race economy. Although it has taken 3+ years to return to 2019 levels, total participation in fitness and endurance races in the second half of 2023 exceeded the same period in 2019, and the first half of 2024 is up 7.9% compared to 2023.
Personally, I’ve always been a fan of endurance races and have competed in a variety throughout my life. Whether it's a twisted desire to push myself into the pain cave or a sense of community that is hard to replicate outside of the shared suffering of hundreds of participants, I find myself continuing to sign up for a variety of races. Just a few weeks ago, I finished the Sarlacc Attack 50k mountain bike race in Fruita, Colorado, and will compete in Hood to Coast Relays and Austin Rattler later this year. It’s this participation that has sparked an interest in exploring the investment potential in the space.
Beyond the pure financial objectives of race operators, I believe these events hold a special responsibility in our indoor-bound, screen-obsessed society, and they are an important part of the broader health and fitness ecosystem. Over a series of posts, I’m going to be doing a deep dive into the Endurance Race industry. This post will cover an industry overview and key insights that I collected from reports and conversations with endurance racing insiders. Part 2 will cover M&A activity in the industry. Part 3 will discuss early-stage technologies disrupting the way races are conducted and operated. Part 4 will cover the endurance-based professional leagues. And I’ll close out the series with Part 5 which will discuss a synthesis of the research and my predictions of what aspects within the space provide the strongest investment potential.
Industry Overview
To start off, I’m defining the Endurance Race industry as any form of participatory athletic event that tests the registrant’s stamina, resilience, and endurance. There is an endless array of event types/distances/disciplines, but at a high level, I broke them down into 4 categories:
Traditional Events: These are the events most people associate with endurance sports, such as 5ks, 10ks, half marathons, full marathons, triathlons, and cycling.
Emerging Events: Newer categories and disciplines that are becoming more mainstream. Examples include trail running, mountain biking, gravel riding, adventure racing, and swim-run.
Functional Fitness: A new category of fitness competition that tries to incorporate more elements of strength and agility in addition to the endurance component. Some common examples include Hyrox, Obstacle Course Racing, and the CrossFit Games.
Community over Competition: Events that emphasize a sense of community over a specific competition. Examples include Runningman, Highlander, and RAGBRAI.
I conduct a market sizing estimate below, but I project that the domestic endurance and fitness race market is approximately $2-$4B, and estimates from Endurance Sportswire project a 5-7% CAGR in the foreseeable future. Numerous factors are driving the industry growth, but some of the most relevant are a general interest in outdoor recreation and health and wellness (accelerated by the pandemic), growth in the experience economy, and technological innovation and improvement that’s making it easier to find, sign up, and participate in races all over the country.
As discussed in the Key Insights section, one surprising aspect of the Endurance Event industry is its fragmentation. Despite its total market size, over 95% of races have less than 500 participants. These are often hyper-local events organized by community leaders.
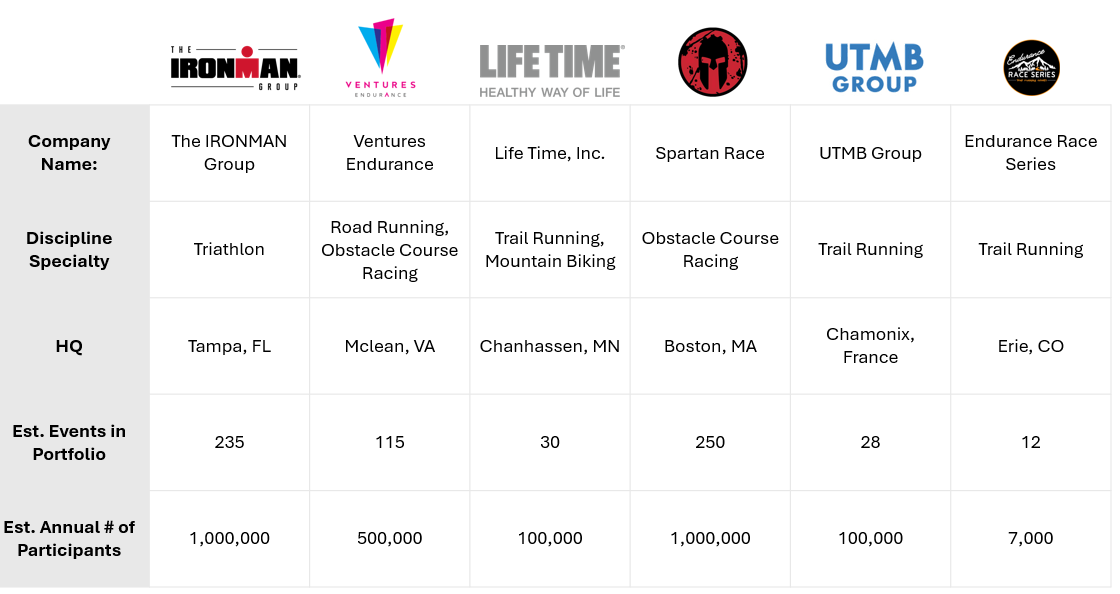
Given the marginal difficulty in scaling larger fitness events and the fragmented nature of the market, the industry presents an ideal M&A environment for companies to build multi-race platforms. I’ll take a deeper dive into M&A activity in Part 2, but below are a few examples of some of the largest industry participants and groups that have successfully expanded horizontally to create multi-race platforms.
Starting with a top-down perspective of the industry as a whole, below is an evaluation of the industry through Porter’s 5 Forces Framework:
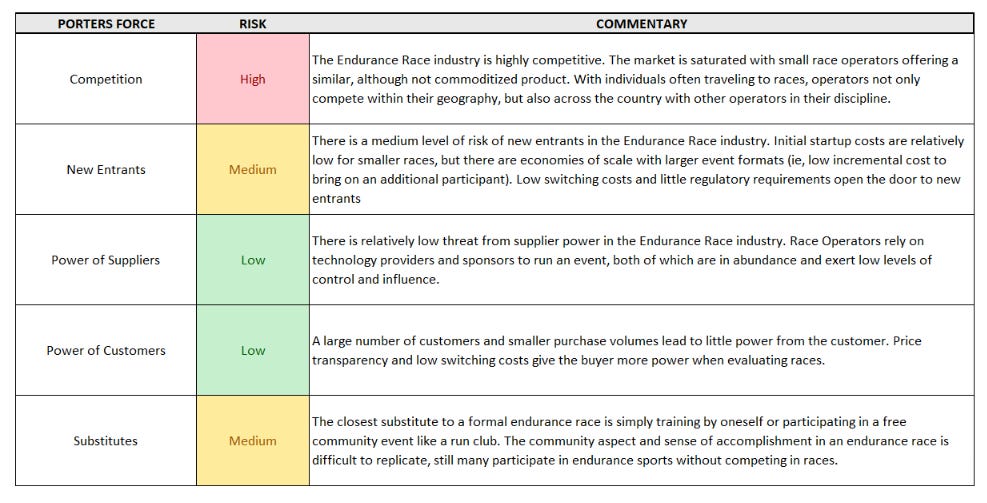
There are mixed signals of overall strength in the Endurance Race industry. There is a high level of competition with some barriers to entry. Suppliers and customers exert little influence, and there is some threat of substitute products.
As with many business models, the industry's attractiveness changes dramatically with scale, and the above-mentioned risks are largely eliminated. Take the IRONMAN Group, for example. They’ve carved out such a strong foothold in the industry that their brand name is synonymous with the discipline of the event itself, essentially eliminating competition in that category. The unique experience across their 230+ events makes it difficult for a new entrant to challenge them in this specific race format, and their size eliminates much of the customer and supplier pricing influence. The brand has gotten so strong that they have the pricing power to charge ~$1,000 entrance fee and the fact that many participants get the brand tattooed on their body after completion of the event.
The industry's attractiveness at scale is a key reason so many large corporations and private equity groups are building multi-race platforms through organic race creation and acquisition.
Market Size
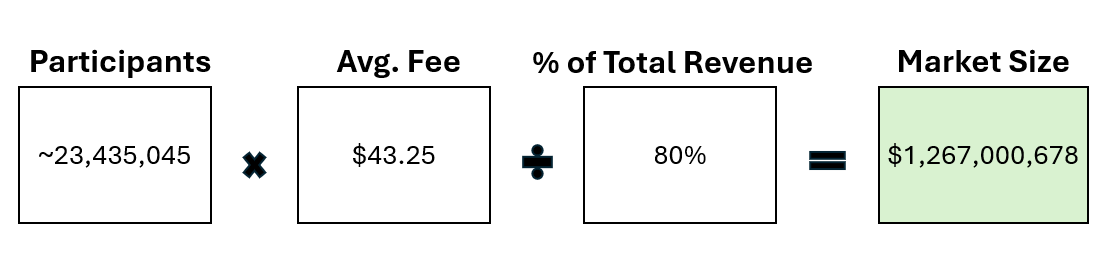
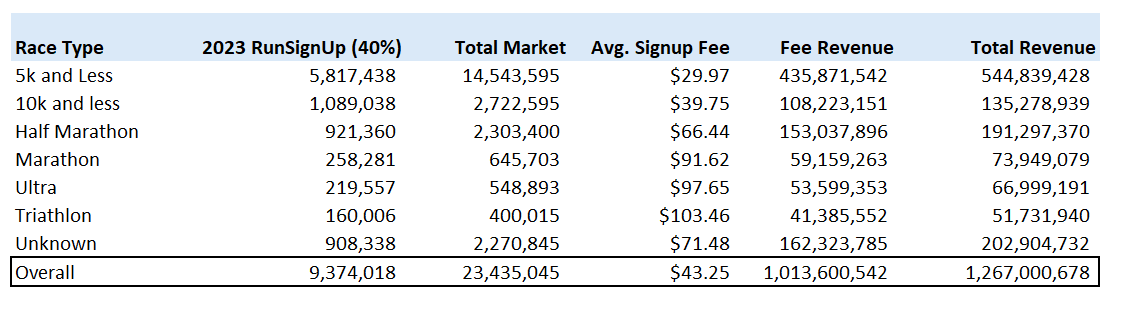
Clearly, there are a lot of endurance races nationwide that cater to different disciplines, but how big is the actual market? I started market sizing with data of the races on the RunSignup platform, which the company believes reflects ~40% of total participation nationwide. Using the average event entry fee, weighted by the total participation numbers, allowed me to determine a rough market size based on event entry alone. Lastly, from seeing the financials of race operators along with conversations with industry insiders, I determined that, on average, 80% of a race's total revenue comes from event entry, with the remainder coming from auxiliary sources, including sponsorships, merchandise, etc.
Using this methodology, I determined an estimated domestic TAM of $1.3B. Given that RunSignup tracks running and triathlon events specifically and may not capture new emerging events such as gravel racing, functional fitness races, or more community-oriented participation events, I revised my market size estimate up to $2-$4B in the US.
A recent article from Tech Crunch estimated the Global Endurance Sports Market at $18B. This difference is most likely driven by their inclusion of equipment, apparel, and nutritional products, which greatly expand the market size of endurance races.
Suffice it to say that despite many races operating at a hyperlocal level, taken collectively, this is a massive business and should be noticed by investment firms in the health and wellness ecosystem.
Key Industry Insight
As a foundation for this project, I reviewed various reports and publications to examine the industry from multiple angles and lay the basis for my thesis on investment potential. Below are a few of the key insights that will be important for the industry's future direction.
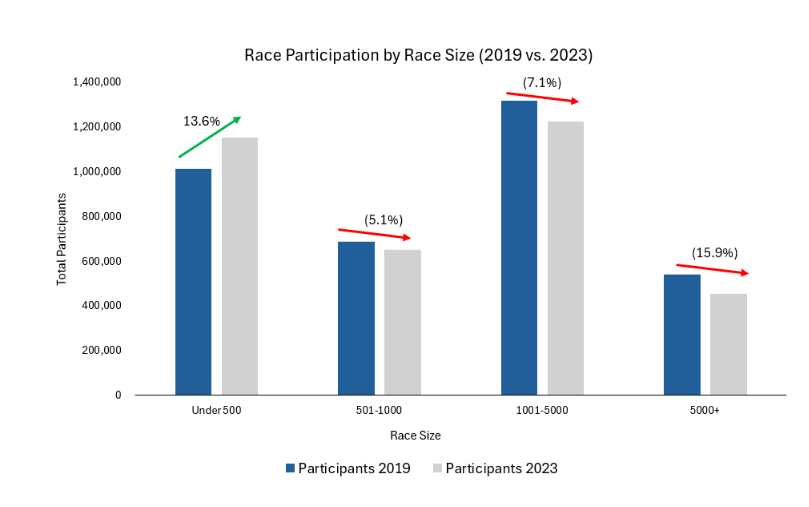
Race Size
Although races such as the Boston Marathon and the New York City Marathon get the most media attention, the endurance race industry is still dominated by small, community-oriented races. According to RunSignup’s database, 95% of events have fewer than 500 participants.
In addition to the number of races, it also appears that smaller races are the healthiest coming out of the pandemic years. In 2023, races with less than 500 registrants grew 13.6% from 2019 levels. This compares to races with between 500 and 5,000 people, which contracted 5-7%, and races with more than 5,000, which contracted by 15.9%.
Through the first half of 2024, it appears larger races are approaching 2019 levels, but their speed of recovery reflects potential consumer preferences and the logistical challenges of running larger races.
Mobile Adoption
One interesting insight is that the industry as a whole has been progressive in its adoption of new technology solutions for race identification, research, and registration. According to RunSignup, 73.5% of race website views were conducted through a mobile device, and 60.4% of transactions were via a mobile application. This proven adoption of a mobile interface is confirmatory evidence of the demand for technology solutions that can disrupt other aspects of the race process, including timing, social interaction, and race preparation. In Part 3, we’ll highlight some early-stage companies building such solutions.
Customer Profile
If spending any sort of time in a running store or bike shop recently, it shouldn’t be a surprise that endurance sports are expensive and, therefore, attract a wealthier cnsumer. According to a report from Fitt Insider, 50% of runners have a household income of more than $100,000 per year, and 25% of triathletes more than $150,000 per year with an average of $126,000. This is in comparison to the US median household income of $74,580.
These figures continue to increase with longer and more arduous race formats. The average household income of Ironman participants is $247,000.
This customer profile is important because it delineates two clear strategies a race operator can pursue. First, a race operator targeting the higher end of this market can attempt to capture a larger wallet share by diversifying into complementary equipment, gear, merchandise, etc, and cross-selling their participants.
A second approach is to recognize that a large percentage of the population is priced out from competing in these high-end events, and there is an opportunity to create race formats and disciplines that are more accessible from a cost perspective.
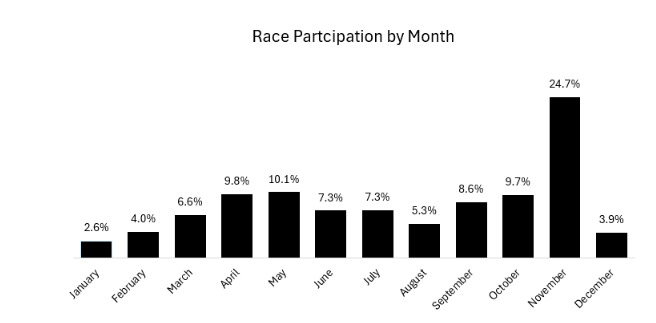
Seasonality
Thanksgiving turkey trots are one of the most common race formats, so unsurprisingly, 24.7% of all endurance races are held in November each year. 36.9% of all events happen in the fall season (September, October, November).
Winter is the industry's slowest season, with 11.4% of total events. This presents an opportunity for a race organizer to create “tune-up” events in locations with moderate climates.

Repeat Participation
One of the most difficult challenges for a race organizer is driving repeat participation. In 2023, on average, 13.6% of event participants signed up for a second year.
Races can implement a variety of techniques to entice repeat participation, including discounts for future races, gamified elements to try and benchmark against previous times, or switching up race merchandise, format, etc. However, the reality is that most races are a capstone to a specific goal, and once that goal is achieved, it becomes less desirable to participate a second time.
This is another key reason that many operators are building a multi-race platform rather than purely focusing on the organic growth of an individual race. Participants can set new goals and try new races, all while staying within a platform ecosystem.
Next Gen. Interest
Beyond evaluating the current race participant profile, I also reviewed high school participation data, which could be a leading indicator of future race interest.
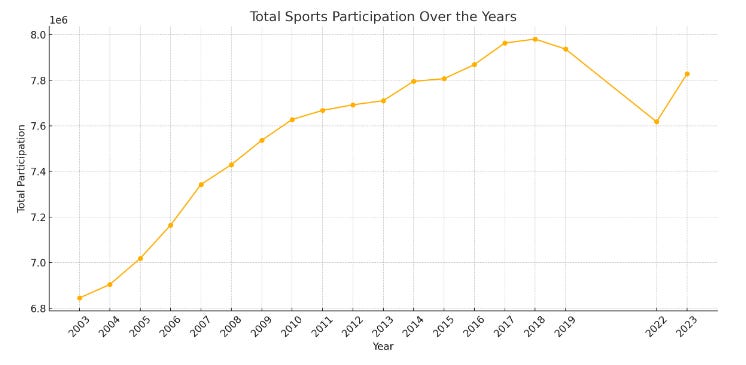
Using 20 years' worth of high school participation data provided by the National Federation of State High School Associations, I attempted to identify trends or interesting insights.
The first thing that caught my eye is the decline in high school sports participation over the last couple of years. Peak participation levels were seen in 2018, with 7,951,034 across all sports. In 2023, total participation was 7,791,789, reflecting a 2% drop. This can be due to a number of factors, including demographic changes, schools tightening budgets, or reporting errors.
An additional possibility is that young adults are moving away from traditional organized team sports and pursuing sports outside of school organizations. If this is the case, it could be a positive signal to the future health of the endurance race industry.
Note: The NFSHSA did not include data from 2020-2021
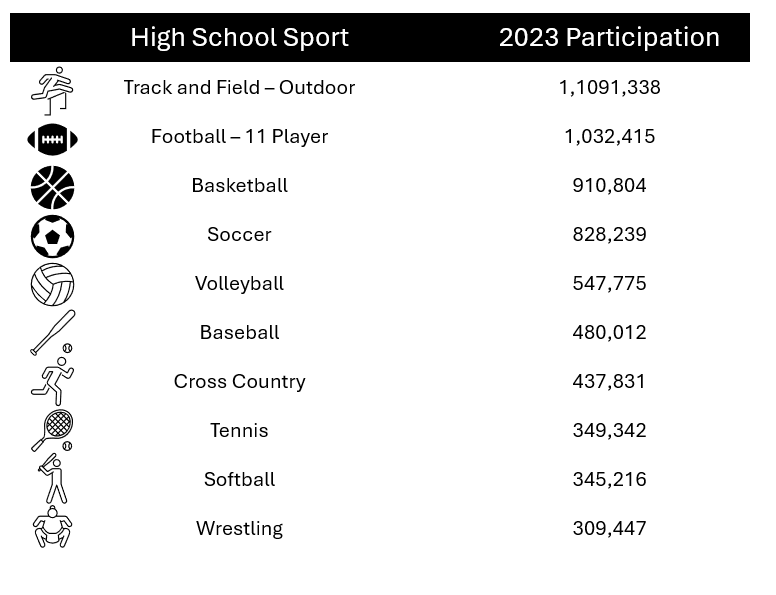
There is still a strong interest in running (Track and Field and Cross Country were the 1st and 7th most popular sports in 2023), but beyond that, we also see some early grassroots efforts for other endurance sports. Mountain Biking, for instance, was one of the fastest-growing sports within high school programs over the last five years, with a 128.1% growth rate.
This data is by no means a definitive bullish or bearish indication of the future of the Endurance Race industry, but I do think it should be perceived as a positive sign. Younger generations are looking for an athletic outlet beyond what their school could provide and may seek this out through participation in endurance events and races.
Risks
I recognize that my commentary thus far has been fairly positive on the industry's prospects, but I think it’s important to acknowledge some of the risks involved with operating an endurance event.
First and foremost, as with any single-event business, operators are exposed to disruptions and cancellations from weather events, issues with the municipality, pandemics, and other factors outside the organizer's control. This potentially exposes the vast majority of revenue to be wiped out entirely.
Even multi-event platforms are still exposed to reputational and financial damage from a disruption or cancellation of an event. One doesn’t have to look hard to find headlines citing the key risks of operating an endurance race. Below is a brief collage of various headlines that I came across in my research that highlight this risk.
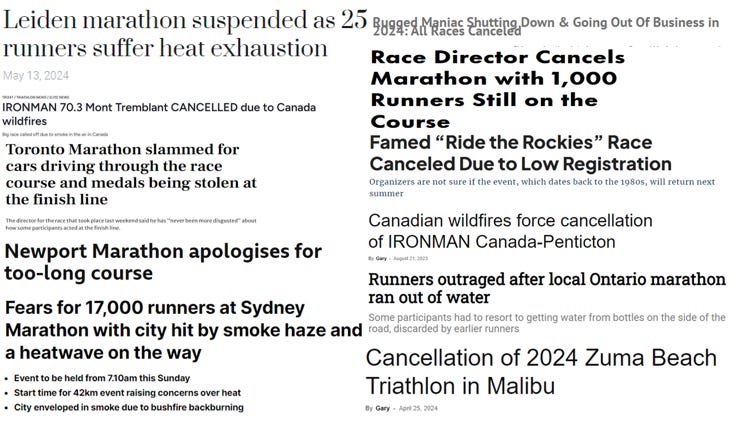
Not all of these risks can be avoided entirely, but they emphasize the importance of mitigation through diversification of event types, formats, and geographies, along with having a skilled race director who has experience navigating the logistical challenges of running a mass participation event.
As I was writing this piece, Life Time Inc. announced the cancellation of one of their marquee gravel events, the Crusher in the Tushar, due to forest fires in Piute County, Utah.
Pushing the Boundaries of Extreme
A final takeaway from my initial research is the apparent insatiable human desire to test the boundaries of athletic capacity. Races across disciplines and geographies are getting longer, more complicated, and more extreme. Below are a few examples of events pushing these boundaries:
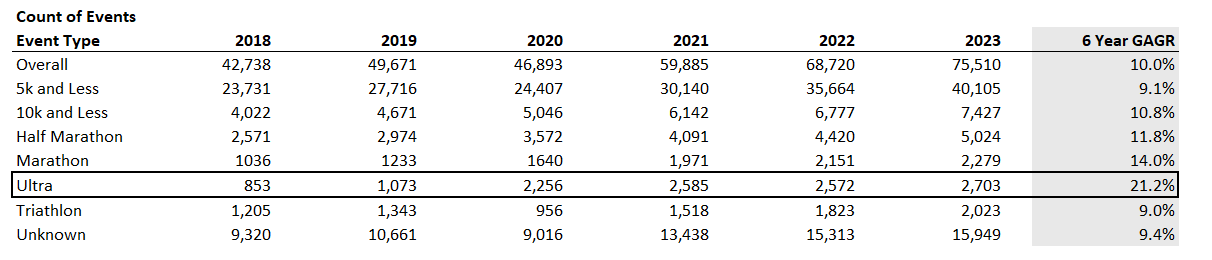
Ultra-Marathon: The marathon used to be the pinnacle of running performance, but now, the new category of Ultra-Marathon, defined as anything over the traditional 26.2-mile marathon race, has become the new high-performance standard. Although starting from a smaller denominator, Ultra Marathons have had the largest percentage growth (21.1% 6-year CAGR) of events hosted on the RunSignup platform.

Hazda 80k: One of the more extreme races that I came across in my research was the Hadza 80k, which is a 50-mile race in Tanzania. What makes this race extreme is not the distance itself but rather the fact that racers cannot bring their own food or water, and there are no aid stations. Instead, racers will have to live like the Hazda people, foraging wild berries, tubers, and honey and climbing baobab trees for water.
Barkley Marathon: This race follows James Earl Ray's prison escape route in Frozen Head State Park, Tennessee, and consists of 100 miles and 60,000 feet of elevation gain. There is no marked course, and racers must navigate only using their own wits, compass, and a map provided one hour before the race start time. The race is so difficult that only ~18 people have completed it in the allotted time in its entire history.
6633 Artic Ultra: This race consists of 120 or 380 miles in Canada’s Yukon Territory, finishing in the Arctic Circle. Runners battle extreme winds, and typical temperatures range from 9 to 30 degrees.
Self-Transcendence 3,100 Mile: The longest certified road race, the Self-Transcendence held in Queens, New York, spans 52 days and entails running 59.6 miles a day for a total of 3,100 miles.
As these races become more extreme, the pool of potential participants reduces. Although many of these race types do not have the same commercial potential from a pure entrance fee perspective, they are still important for the industry as they draw media attention and create aspirational figures that could inspire someone to take a plunge into the sport. Superhuman characters such as David Goggins and Courtney Dauwalter have undoubtedly brought a huge swath of people into trail running, just as Rich Roll and the Iron Cowboy brought media interest to triathlon.
Conclusion + Next Post
As discussed at the beginning, this is Part 1 of a five-part series. In Part 2 of this project, I’ll take a closer look at early-stage technologies that are redefining how individuals search for and sign up for races, the social media platforms that connect participants, and the tools that help people train to push their performance potential.
If you are looking to launch an endurance event or are a current operator in the space, I’d love to connect and share this passion. Thanks as always for reading!
as someone who works in this industry-- this is extremely insightful and helpful. Thank you for these pieces they are a fantastic resource and appreciate you citing the sources too!